TechnoMotive Datalogs - ¼ Mile Performance
by Jeff Lucius
The TechnoMotive Datalogger is a diagnostic and monitoring tool that allows you see the internal workings of the engine control unit (ECU). It consists of a cable that connects the car's diagnostic port to a portable computer, and DOS or Windows 95/NT software. The TMO datalogger is available for 1991-1995 DSM cars and 1991 through 1993 Mitsubishi 3000GT/Dodge Stealth cars (with OBDI-style ECU connector and diagnostic port).
Introduction
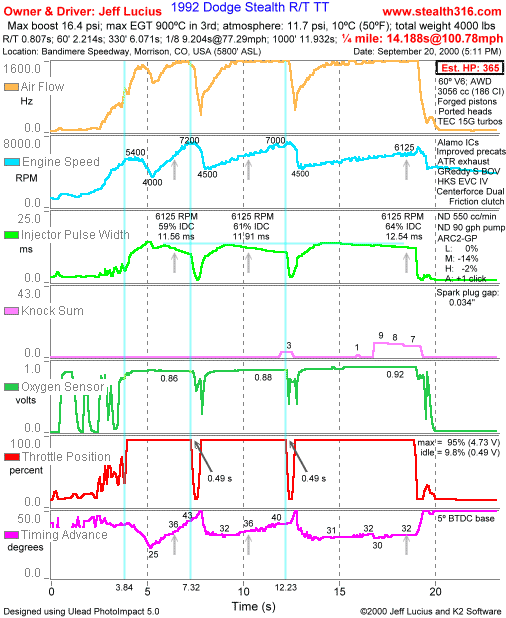
The date, location, site conditions, performance results, and relevant modifications are listed in the figure below. I should add that I was using 91 octane street gas from Phillips 66. The TechnoMotive Datalogger chart below shows seven ECU data values on the vertical axis versus time on the horizontal axis. This datalog was recorded during my third ever attemp at drag racing.
The Air Flow value is reported in Hz (frequency) by the ECU as is customary for our Karman Vortex mass air-flow sensor (MAS). I use two different methods to estimate the conversion of Hz to cubic feet per minute (CFM). I think the second method is more accurate. Using values for Hz, fuel flow at idle (36 psi line pressure), and a 14.7 air/fuel mixture, I estimate there are approximately 0.32 CFM of air flowing for every Hz for my 550 injectors and Split Second MAS. I estimate 0.21 CFM/Hz for the stock MAS. These are just rough estimates (that appear somewhat low). Using 760 CFM airflow in 2nd gear at 6125 RPM and an extrapolation of 1760 Hz for the MAS signal, I estimate about 0.43 CFM/Hz with my ARC2 settings and about 0.29 CFM/Hz for the stock MAS. The computer reports a maximum Hz value of 1606 to the datalogger but the stock MAS is capable is sending signals up to about 2000 Hz (or about 580 CFM estimated).
In the Engine speed graph, the oscillations of the RPM lines are not real and are a function of datalogger data acquisition.
The Injector Pulse Width (IPW) is the amount of time (in milliseconds) that the ECU wants the injectors to be open between compression strokes. The injector duty cycle (IDC) in percent is determined by multiplying the RPM times the IPW and dividing by 1200.
The Knock sum is a value determined by the ECU from monitoring the frequency output of the knock sensor and other engine functions.
The TMO datalogger monitors the rear exhaust gas Oxygen Sensor.
Throttle Position in percent is determined by dividing the voltage output of the TPS (throttle position sensor) by 5 volts.
The Timing Advance reported by the TMO may not be the actual timing value seen by the engine. My timing light shows about 10º advance at warm idle while the TMO shows about 28º advance at the same time. However, it may not be as simple as dividing the values seen below by three because 11º to 14º advance at high RPM seems a bit low. Supposedly the base timing is not included in the reported value.
Analysis of the ¼ Mile Performance
Well I certainly didn't set any records, but overall I was pleased with my first attempts at drag racing and the car's performance. Most importantly I didn't break anything on the car. In the figure below, I have drawn a vertical line at 3.84 s to indicate when I reacted to the last amber light on the start tree and pressed the acceleration pedal to the floor. The engine was at about 5400 RPM and you can see that my release of the clutch bogged the engine down to about 4000 RPM. I shifted into second gear at about 7200 RPM (the vertical line at 7.32 s) and into third gear at 7000 RPM (the vertical line at 12.23 s). Though I was hoping to break into the 13s (I brought my motorcycle helmet), I was still happy with my 14.188, which is a tenth or two faster than my friend's supercharged 5.0 Mustang.
There is plenty of room for improvement in my technique. Reaction time of 0.807 is fair but 0.500 is "perfect". I am not sure how to improve hook-up at the start. Maybe a bit higher RPM and quicker (or slower?) clutch release? Please email me with helpful suggestions or comments. I also should shift at about 7000 RPM into second gear and at about 6800 into third gear. I took my time shifting, about 0.5 seconds, to preserve my synchros.
I know what you are thinking, "Only 14.2 in the ¼ mile? That's no better than stock!". Hey, that's not bad at 5800 feet above sea level. Here is what I think the car would be capable of at sea level with a professional driver, or even a good average driver. First, subtract 0.4 from my 60' time; 1.8 s is more typical for 60'. I understand that every tenth off of the 60' time is good for 2 tenths off the ET. Now ET is 13.4 sec. and terminal velocity would probably be about 104 mph. Using the NHRA Altitude Correction Factor for Stock and Super Stock of 0.9315 (for 5500' altitude above sea level) the ET would drop to a theoretical 12.5 sec. if the car had been at sea level (and it had the extra fuel capability, which it does). The NHRA Altitude Correction Factor for MPH is 1.0731 for 5500' ASL to project a theoretical 112 mph for terminal velocity at sea level. So "12.5 sec. at 112 mph" is not too bad, theoretically speaking of course.
Turbos are volumetric devices. I seem to be limited to about a 2.5 overall pressure ratio (PR) after pressure losses through the intercoolers and intercooler piping (about 2.8 PR at the turbo). At sea level, the boost would be 1.5 times 14 psi or about 21 psi, much more than the 16.4 psi achieved for this drag run. Unfortunately, the air volume is still the same, which is about 780 or so CFM, just about what two 15G turbos are capable of supplying. I think the new TD04-18T hybrid would make a huge improvement in performance for my car because it has higher pressure ratios near the volumetric requirements of our engines. The GT-368SX turbos can flow more air but they are optimized for larger engines than ours and the PR/flow rate curves do not match up well below 7000 RPM.
Analysis of the Datalog
I have drawn several reference marks in the figure below. There are 3 light-cyan vertical lines at 3.84 s (start), 7.32 s (shift from 1st into 2nd gear), and 12.23 s (shift from 2nd into 3rd gear). In the Injector Pulse Width graph I added a horizontal line for slope comparison. I have also indicated the approximate location of the 6125-RPM "point" in each gear using gray arrows in the Engine Speed, Injector Pulse Width, and Timing Advance graphs.
Air Flow. Because I replaced my stock 360 cc/min fuel injectors with 550 cc/min injectors and the stock MAS with a Split Second MAS and ARC2 A/F calibrator, the air flow values are about 50% less than they would be for a stock setup. Still, the reported values are clipped at 1606 Hz by the limitations of the ECU. An upgrade to 720 cc/min injectors would bring all airflow values under the 1606-Hz ceiling. Airflow values increase with both engine speed and load. As others have pointed out (most notably Roger Gerl), our cars are not under heavy load at wide-open throttle (WOT) until they reach 3rd gear. This can be easily observed using the 6125-RPM arrows. In first gear, the airflow values are not clipped at the 1606 ceiling until about 6500 RPM. The over 12:1 mechanical advantage provided by the drive train keeps engine load low even at WOT. In second gear, the values started to be clipped at about 5700 RPM. In third gear, the values are clipped by 5500 RPM. If the entire range of airflow values were displayed and the actual boost pressures noted at particular RPMs, then the airflow could be converted into boost pressure. Even with my 15G turbos I see pressure fall off above 5500 or so RPM. I am not sure if this is due to a pressure leak somewhere, an intake restriction before the turbos, or increased volumetric efficiency from modifications. From the graph though, it appears that airflow, if not boost pressure, stays high right up to red line.
Engine Speed. How fast the engine can increase in speed over time is called the acceleration time frame. The higher mechanical advantage of lower gears is reflected in the datalog as steeper slopes for the RPM curves (and faster acceleration rate). For this datalog record and my car (with a weight of about 4000 pounds with driver and ¼ tank of gas), the engine accelerated at 1778 RPM/s in 1st gear, 615 RPM/s in 2nd gear, and 242 RPM/s in 3rd gear. I have no idea how this compares to other cars. It would be interesting to take datalogs from several of ours (with the same weight) in various stages of modification at the same racetrack and compare the results.
Injector Pulse Width. The length of time the fuel injectors are fired decreases with RPM because the injector is activated more times per second. This is why the curves slope downward in each gear. A better measure of injector function is duty cycle, or the percentage of time the injector is actuated during the time between cylinder ignition firing. Most manufacturers recommend an IDC of no more than 80% for continuous operation. This graph shows that the ECU is richening the air-fuel ratio as load increases in higher gears. The IDC increases by 5% when measured at the same RPM (6125) from 1st gear to 3rd gear. If I were still running the stock 360 cc/min injectors, the corresponding IDCs would be 88.5%, 91.5%, and 96%.
Knock Sum. The knock count, which quantifies cylinder detonation, that is reported by the ECU is a number calculated using the frequency output (vibration) of the engine knock sensor along with information about other engine conditions. From what I have read, the ECU does not retard timing if the count is below 7. My engine did not start knocking to the point that the ECU was concerned until 5700 RPM in 3rd gear. A small reduction in timing advance lowered the knock count until I let off on the throttle at the end of the race. In addition to retarding timing, the ECU will also dump fuel to control serious detonation, which might be knock counts of 15 and higher.
Oxygen Sensor. The exhaust gas oxygen (EGO) sensor is used by the ECU in a feedback loop during idle, cruising, and low-load acceleration to keep the air-fuel mixture near a stoichiometric ratio of 14.7:1. When the EGO sensor stops cycling the ECU reverts to stored 3D maps to calculate ignition timing and injector pulse width. In the graph below, you can see the EGO sensor cycling until I start racing. The WOT numbers shown cannot be converted unambiguously into A/F ratios because of low sensitivity of the sensor away from a 14.7:1 ratio plus small variations from sensor to sensor and from car to car. However, the relative values are useful, and you can see that the EGO voltage increases in each gear, just as the IDC percentages do, to indicate progressively richer mixtures. In third gear, there is knock even though the EGO voltage shows a rich mixture of 12.5:1 or less.
Throttle Position. For drag racing, the throttle position is useful for determining the time it takes to shift gears; unless of course you do not "lift to shift". I took my time shifting (0.5 seconds) so as not to stress my synchros. Do not let the 95% opening bother you. I have visually checked for complete throttle plate opening at this voltage (4.73). The ECU wants see 4.5 to 5.5 V from the TPS to indicate WOT and 0.3 to 1.0 V for the throttle in the idle position. In the DRB2 mode (no logging) the TMO can indicate voltages for easy analysis of sensor functions.
Timing Advance. Supposedly, the timing values displayed by the TMO are what the ECU adds on top of the base timing. However, when my timing light shows 10º advance at warm idle, the TMO shows 28º advance. Even though we cannot assume that the reported values represent the actual ignition timing, the relative values are still very useful. In general, timing advance increases with RPM. Timing advance decreases with engine load (as combustion pressure builds and the chance for detonation increases) and with richer mixtures (denser mixtures burn faster). The relatively high values in first gear in the graph below re-affirm that the engine is not under heavy load. In 3rd gear, you can see that the ECU retarded timing by 2 degrees when it saw 9 knock counts. When the knock count lowered, advance increased. One side effect of using an A/F calibrator (such as the ARC2, AFC, or VPC) and larger injectors is that the ECU thinks that less air is flowing (less load right?) so it will keep timing advance a little higher. This is good for performance but also increases the chance of knock. On the other hand, the little bit of retard that results from a small amount of knock still leaves timing on the healthy side of 20.
Summary
The TMO datalogger provides very useful information to improve ¼ mile track performance. The engine speed documented the bogging caused by my poor launch technique and the fact that I shifted at too high a speed. It also shows that I was not having a problem with spark blowout. The IPW shows that there is plenty of injector capacity left if I can manage to increase boost pressure and airflow. The knock that developed in 3rd gear was not dangerous but did retard timing and possibly reduce performance. The EGO readings show that I am not running lean. The throttle position showed that I at least kept the pedal down all the way except between shifts.
The TMO information also helped me determine the likely maximum engine power output of 365 HP. I used the 61% IDC at typical peak output RPM (near 6000) and a BSFC (brake specific fuel consumption) of 0.525 (at moderate load levels in 2nd gear). Maximum power could be as much as 383 HP, if BSFC was as low as 0.5, or as low as 348 HP, if BSFC was as high as 0.55. If the car were down near sea level, where density is about 19% greater, then maximum power would be about 434 HP (414 to 456 range) at the same airflow levels.
If you have the TMO software, you can download and view the original log below. Others can download and view the Microsoft Windows Excel version of the file.
TMO log file for September 20, 2000 - Drag strip
MS Excel file for September 20, 2000 - Drag strip
Page last updated March 17, 2002.